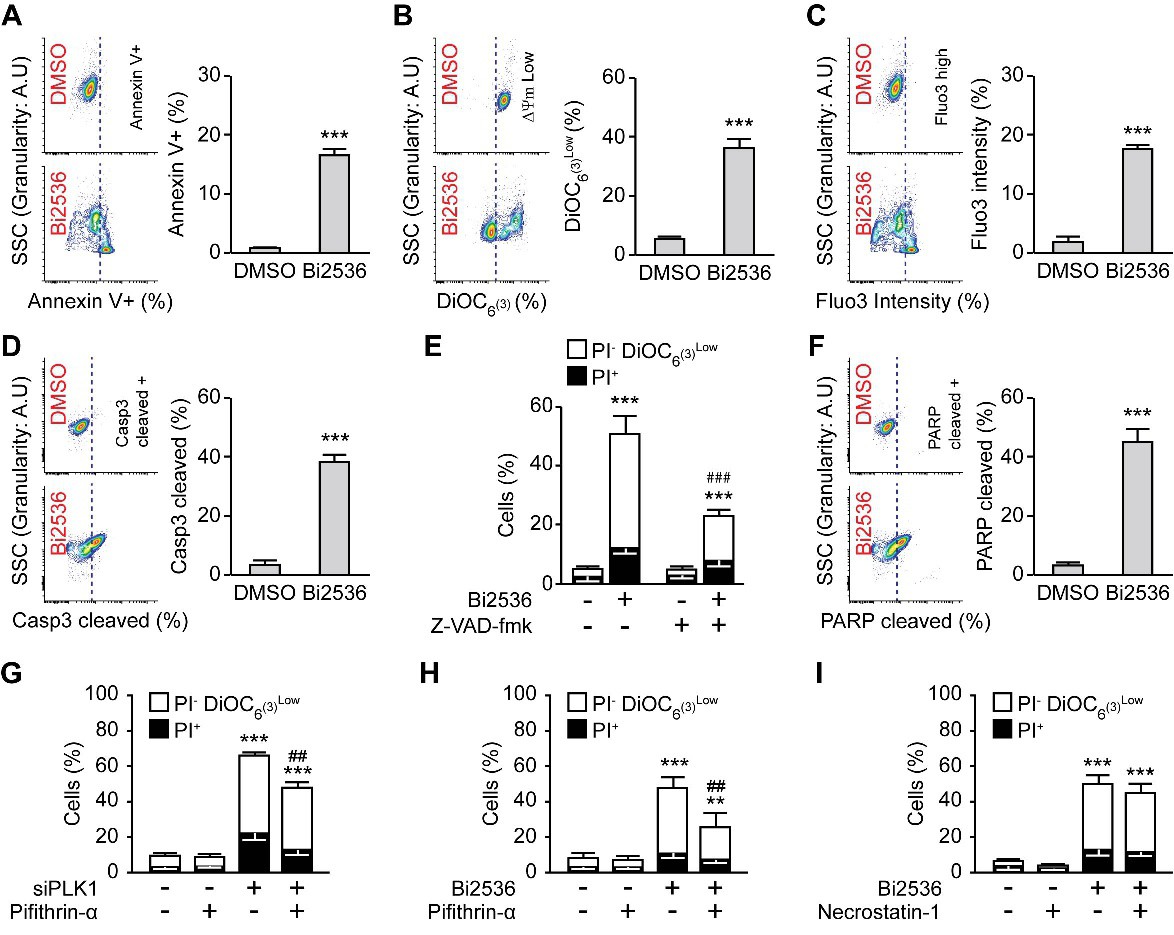
Fig. 3. PLK1 inhibition killed tetraploid colon cancer cells via the intrinsic apoptotic pathway. A. Tetraploid RKO cells were seeded before treating with DMSO or 10 nM Bi2536. After 72 h, the cells were collected and stained with FITC-conjugated Annexin V and analysed by flow cytometry for the detection of phosphatidylserine exposure. Representative dot plots are presented in the left panel, and quantitative data are presented in the right panel. B. The cells were stained with the mitochondrial membrane potential (Δψm)-sensing dye DiOC6(3). Representative dot plots (left panel) and quantitative data (right panel) of the signal shift of DMSO and Bi2536 treated cells are represented. C. The cells were stained with the calcium dye Fluo-3 to quantify the cytosolic Ca2+ concentration by flow cytometry. Representative dot plots of DMSO and Bi2536 treated cells are showed and quantitative data of the signal shift are represented. D. The cells were fixed with cold 75% ethanol and labelled with the FITC-conjugated Casp3 c to detect cleaved caspase-3 by flow cytometry. Representative dot plots of DMSO and Bi2536 treated cells are shown, and quantitative data of the signal shift are represented. E. The effects of the pan caspase inhibitor Z-VAD-fmk on PLK1-inhibitor-induced cell death. Tetraploid RKO cells were treated for 72 h with the PLK1 inhibitor alone or in combination with 50 μM Z-VAD-fmk, followed by DiOC6(3)/PI co-staining. The white and black columns depict the percentage of dying (PI−DiOC6(3) low) and dead (PI+) cells, respectively. F. The cells were fixed with cold 75% ethanol and labelled with a cleaved PARP antibody to detect cleaved PARP by flow cytometry. Representative dot plots of DMSO- and Bi2536-treated cells are shown, and quantitative data of the signal shift are represented. G. The effects of the p53 antagonist pifithrin-α (PFT-α) on PLK-knockdown-induced cell death. Tetraploid RKO cells were transfected with siUNR or siPLK1 for 72 h alone or in combination with 20 ng/ml PFT-α followed by DiOC6(3)/PI co-staining. Quantitative data are represented. The white and black columns depict the percentage of dying (PI−DiOC6(3) low) and dead (PI+) cells, respectively. H. The effects of the p53 antagonist PFT-α on Bi2536-induced cell death. Tetraploid RKO cells were treated for 72 h with Bi2536 alone or in combination with 20 ng/ml PFT-α followed by DiOC6(3)/PI co-staining. Quantitative data are represented. The white and black columns depict the percentage of dying (PI−DiOC6(3) low) and dead (PI+) cells, respectively. I. The effects of the necroptosis inhibitor necrostatin-1 on PLK1-inhibitor-induced cell death. Tetraploid RKO cells were treated for 72 h with the PLK1 inhibitor alone or in combination with 100 μM necrostatin-1, followed by DiOC6(3)/PI co-staining. Quantitative data are represented. The white and black columns depict the percentage of dying (PI−DiOC6(3) low) and dead (PI+) cells, respectively. Data are reported as means ± SD (n ≥ 3). ***p<0.001, **p<0.01 (Mann-Whitney test), as compared to the control. ###p<0.001, ##p<0.01 (Mann-Whitney test), as compared to diploid subjected to the same treatment condition.